What’s Github Profile?
Normally, GitHub’s homepage shows its warehouse information, submits information. But if you visit somebody else’s github, you find some home pages that light you up. This custom home page can provide more details about your contribution, submission and personal information than the default home page contains much more information. Of course, you can copy my Github configuration and then modify it. My configuration file is as follows.
Github:QTH1225/QTH1225
We first know the method of setting up the profile in the github, and then we’ll be fine. We’ll start by building a new warehouse on GitHub with the same name as our own Github user, and then we’ll add a README.md self-descript file, and we’ll just add information to this file. The information in this file will automatically be added to your Github homepage.
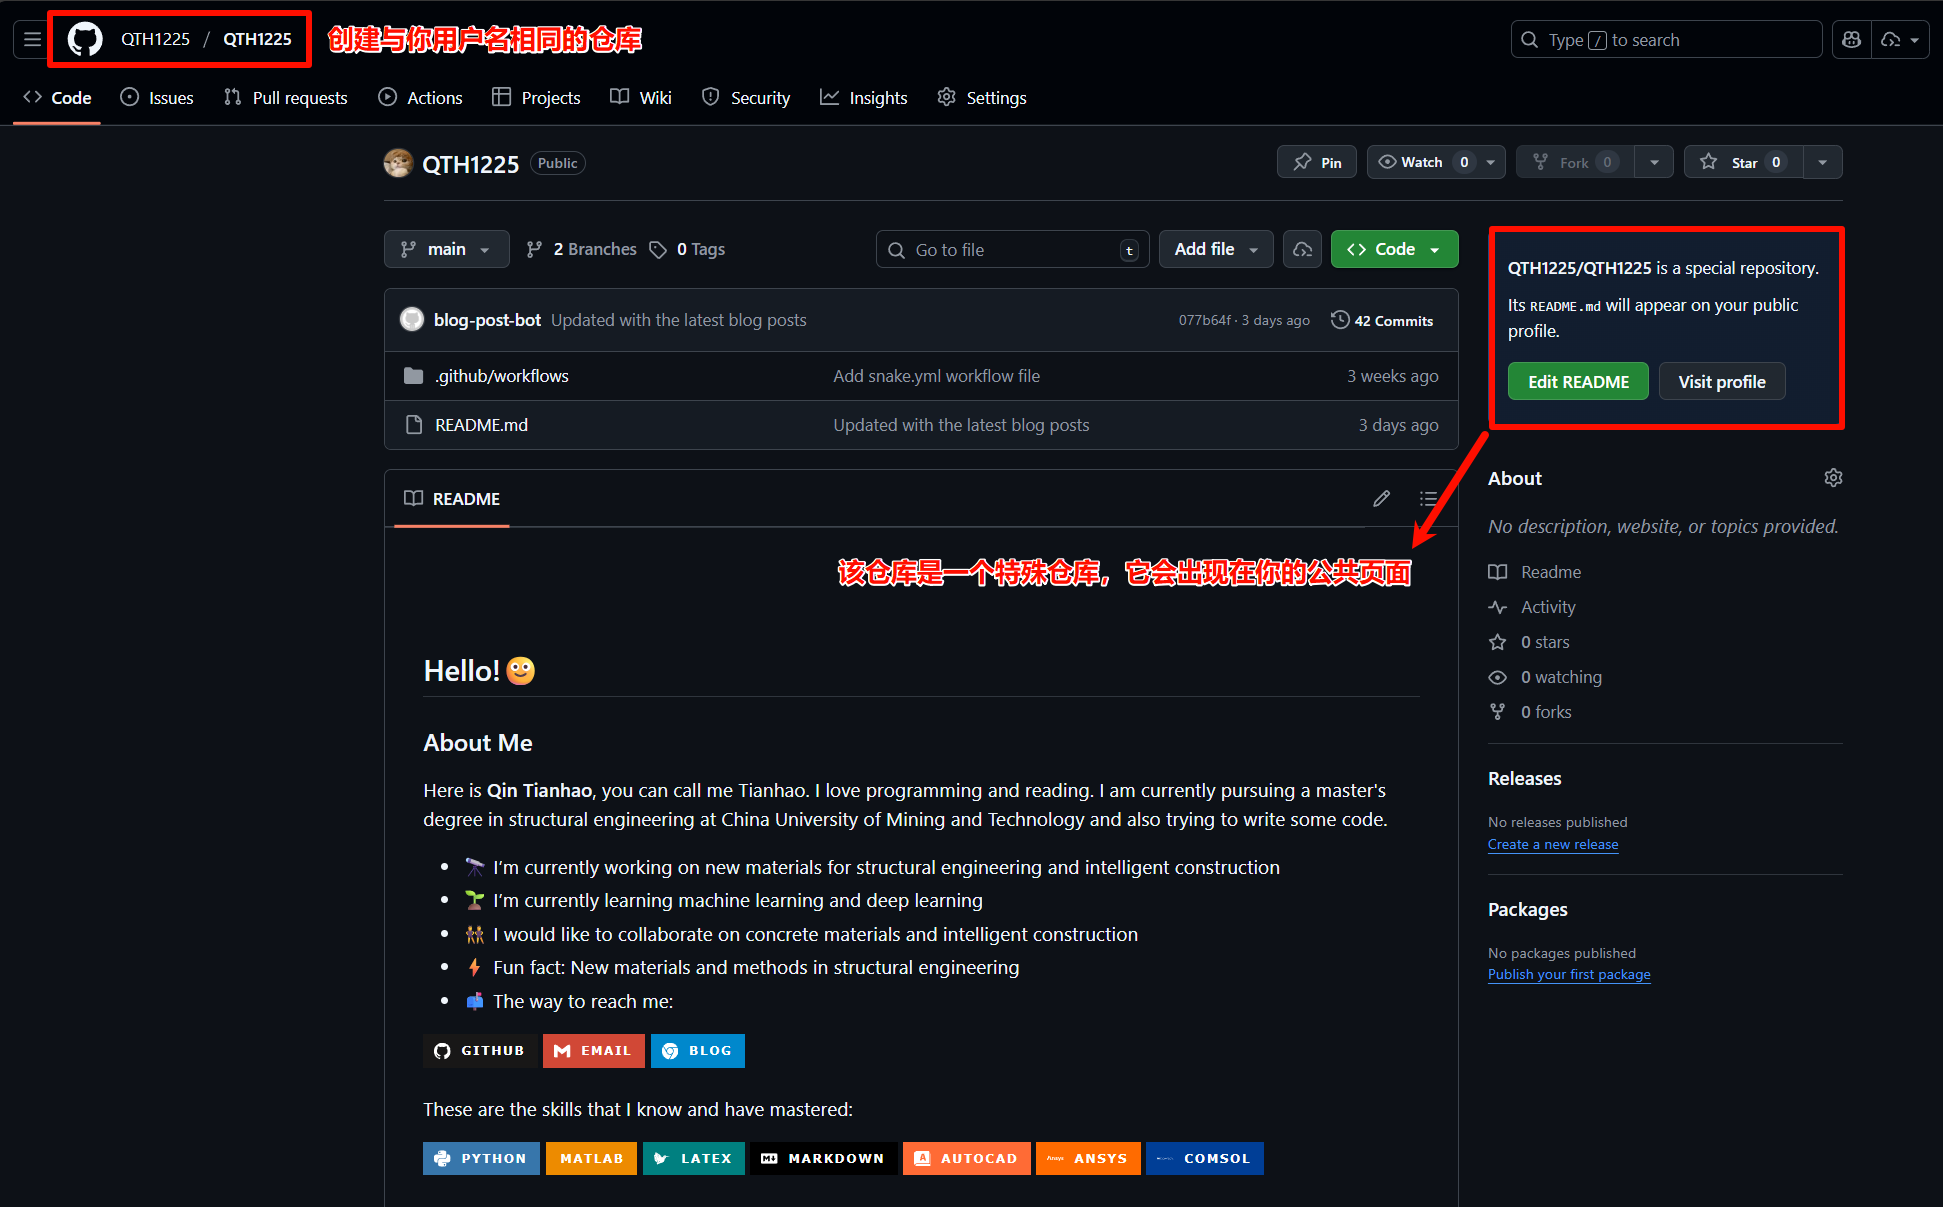
Customise sidebar
Of course, before we customize our github homepage, remember that GitHub can add basic information to the sidebar, including names, signatures, companies, mailboxes, and links. Sidebars are also an important part of personal information.
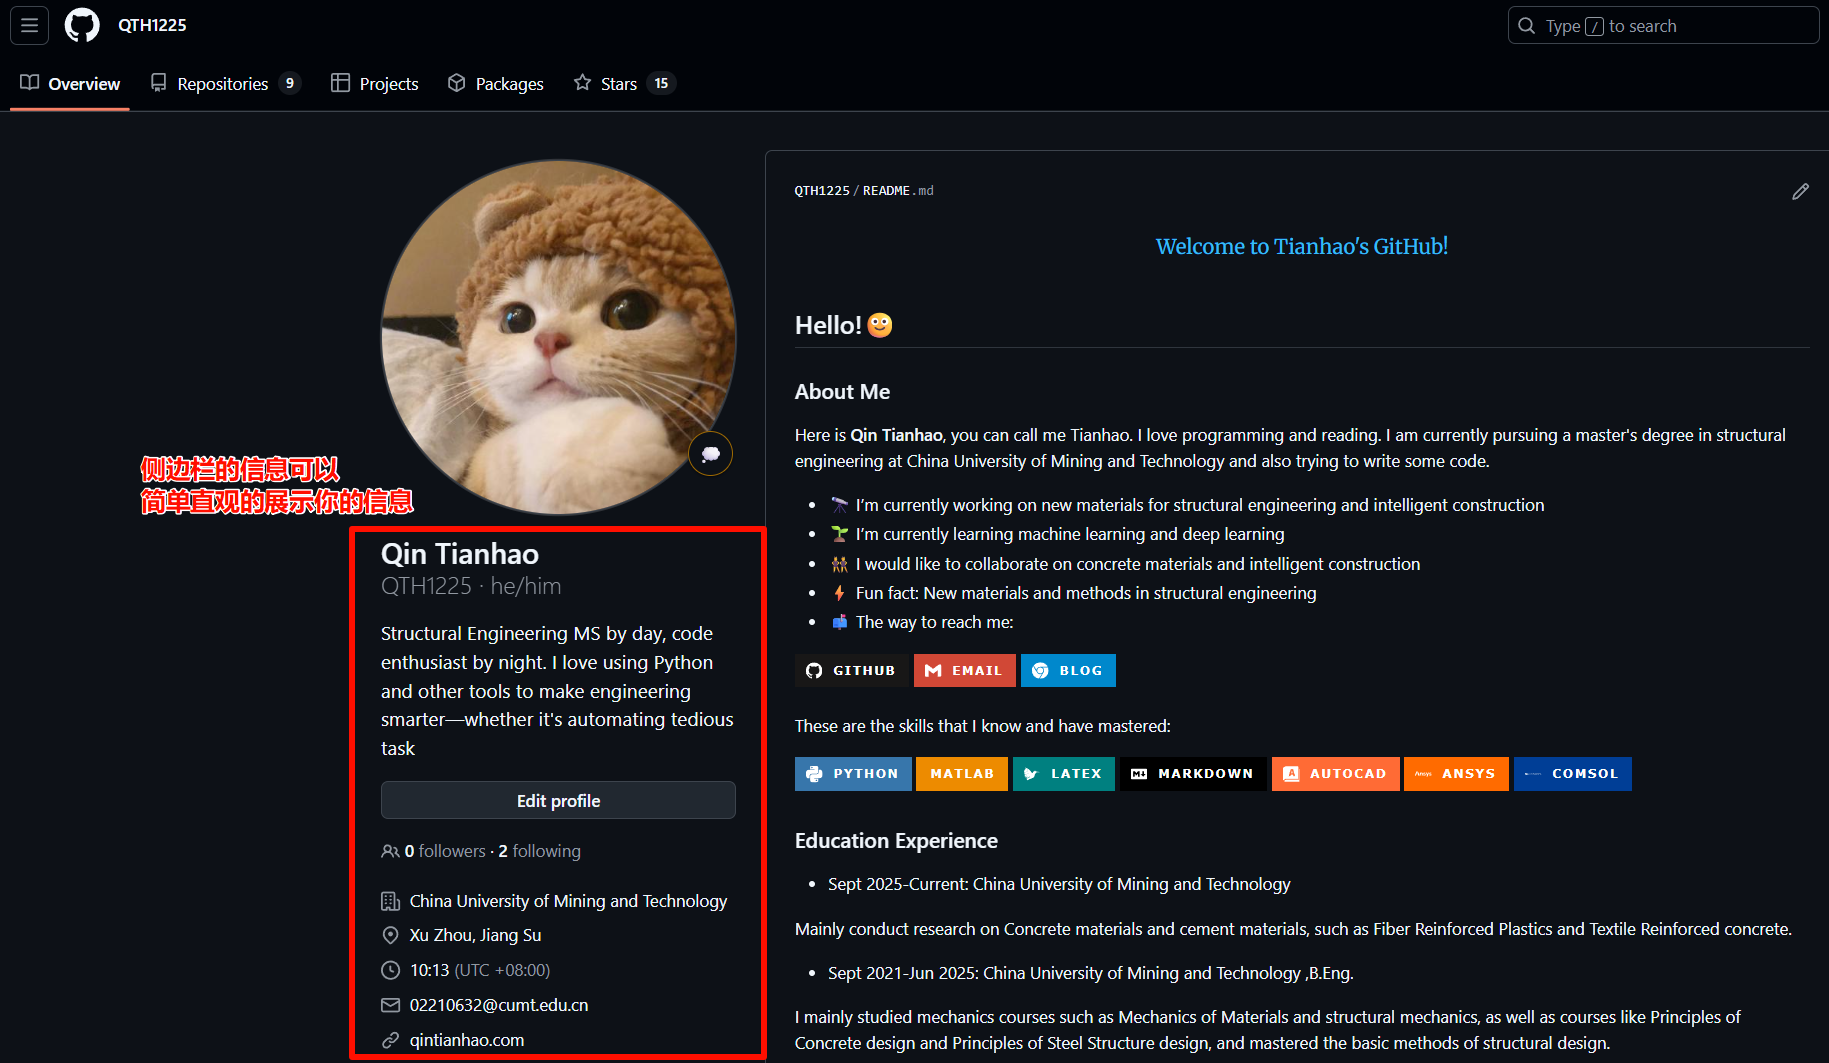
Components used
Typewriter
You can display your GitHub information in typewriter form, which can produce the following:
The address of the project is as follows:
DenverCoder1/readme-typing-svg
Of course, you can adjust the font and the location and size of the situation, like the configuration in my warehouse.
[](https://git.io/typing-svg)Emblem.
You can simply show your tech store or contact in the form of a badge.Shields.ioPerforming the generation of the badge. These badges can be linked to your personal information page, such as the following.
[](https://github.com/QTH1225)
[](mailto:1340356343@qq.com)
[](https://tianhao.blog)
These are the skills that I know and have mastered:Of course, they can only be shown.





Blog Link
If you have your own technical blog and RSS, you can link your latest post in your GitHub profile.
gautamkrishnar/blog-post-workflow
According to the warehouse’s instructions, first you need to add the following piece to your Markdown file, and the next job stream created will be the first to be created.<!-- BLOG-POST-LIST:START -->and<!-- BLOG-POST-LIST:END -->The part of the blog is replaced by your latest blog.
### Blog posts
Here is my blog. You can find some of my study and thinking records here.
<!-- BLOG-POST-LIST:START -->
<!-- BLOG-POST-LIST:END -->
And then create a workflow (e.g., blog-post-workflow.ymlThe text is as follows.feed_listThe following is a link to your blog RSS.
name: Latest blog post workflow
on:
  schedule: # Run workflow automatically
    - cron: '0 * * * *' # Runs every hour, on the hour
  workflow_dispatch: # Run workflow manually (without waiting for the cron to be called), through the GitHub Actions Workflow page directly
permissions:
  contents: write # To write the generated contents to the readme

jobs:
  update-readme-with-blog:
    name: Update this repo's README with latest blog posts
    runs-on: ubuntu-latest
    steps:
      - name: Checkout
        uses: actions/checkout@v4
      - name: Pull in dev.to posts
        uses: gautamkrishnar/blog-post-workflow@v1
        with:
          feed_list: "https://tianhao.blog/en/index.xml" # Replace this with your RSS link
Snake Eating Data Contribution Map
You can show your contribution in your GitHub profile in the form of a snake-eating scheme, like this.

snk.ymlAs follows, no submission or change is required.
name: generate animation

on:
  # run automatically every 2 hours
  schedule:
    - cron: "0 */2 * * *"

  # allows to manually run the job at any time
  workflow_dispatch:

  # run on every push on the master branch
  push:
    branches:
    - master


jobs:
  generate:
    permissions:
      contents: write
    runs-on: ubuntu-latest
    timeout-minutes: 5

    steps:
      # generates a snake game from a github user (<github_user_name>) contributions graph, output a svg animation at <svg_out_path>
      - name: generate github-contribution-grid-snake.svg
        uses: Platane/snk/svg-only@v3
        with:
          github_user_name: ${{ github.repository_owner }}
          outputs: |
            dist/github-contribution-grid-snake.svg
            dist/github-contribution-grid-snake-dark.svg?palette=github-dark


      # push the content of <build_dir> to a branch
      # the content will be available at https://raw.githubusercontent.com/<github_user>/<repository>/<target_branch>/<file> , or as github page
      - name: push github-contribution-grid-snake.svg to the output branch
        uses: crazy-max/ghaction-github-pages@v3.1.0
        with:
          target_branch: output
          build_dir: dist
        env:
          GITHUB_TOKEN: ${{ secrets.GITHUB_TOKEN }}
Then we need to add the following HTML code to the Markdown file, and replace all links with your own.
<picture>
<source media="(prefers-color-scheme: dark)" srcset="https://raw.githubusercontent.com/QTH1225/QTH1225/output/github-contribution-grid-snake-dark.svg">
<source media="(prefers-color-scheme: light)" srcset="https://raw.githubusercontent.com/QTH1225/QTH1225/output/github-contribution-grid-snake.svg">
<img alt="github contribution grid snake animation" src="https://raw.githubusercontent.com/QTH1225/QTH1225/output/github-contribution-grid-snake.svg">
</picture>
GitHub Visitors Statistics
You can insert the following code directly into Markdown’s file to count the number of visits to your home page.Moe Counter!Generates the code you need to insert directly, and then inserts it in your Markdown document.moebooruThe theme, or it could be replaced with other themes.
The number of views of this page is as follows.

<img src="https://count.getloli.com/@QTH1225?theme=moebooru"/>
GitHub data statistics
The following warehouses are used. anuraghazra/github-readme-stats You can choose the statistical style and data you like in the warehouse (not only for the display of these two types of data). Here, the user uses the HTML syntax in the warehouse for card alignment, copying the code and replacing the user name with your user name.
<a href="https://github.com/anuraghazra/github-readme-stats">
  <img height=200 align="center" src="https://github-readme-stats.vercel.app/api?username=QTH1225&show_icons=true&theme=transparent" />
</a>
<a href="https://github.com/anuraghazra/convoychat">
  <img height=200 align="center" src="https://github-readme-stats.vercel.app/api/top-langs?username=QTH1225&layout=donut&langs_count=5&card_width=320&theme=transparent" />
</a>
Monthly statistical map submitted by GitHub
You can show your monthly changes in your contribution in your GitHub profile in the form of a liner, as shown below.
The warehouse used by the user is this one, and it is possible to choose the style of preference in the warehouse.
Ashutosh00710/github-readme-activity-graph
Add this code to your Markdown file and change it to your own information.
[](https://github.com/ashutosh00710/github-readme-activity-graph)GitHub Profile Editor
If you don’t want to do a detailed component study, you can use it.GitHub Profile Editor. This is a visual profile generation tool, the user does not need to learn Markdown syntax, simply has to enter or select the corresponding content in the corresponding window, and the tool automatically generates Markdown scripts. Once the script is edited, it is simply copied to its Github.
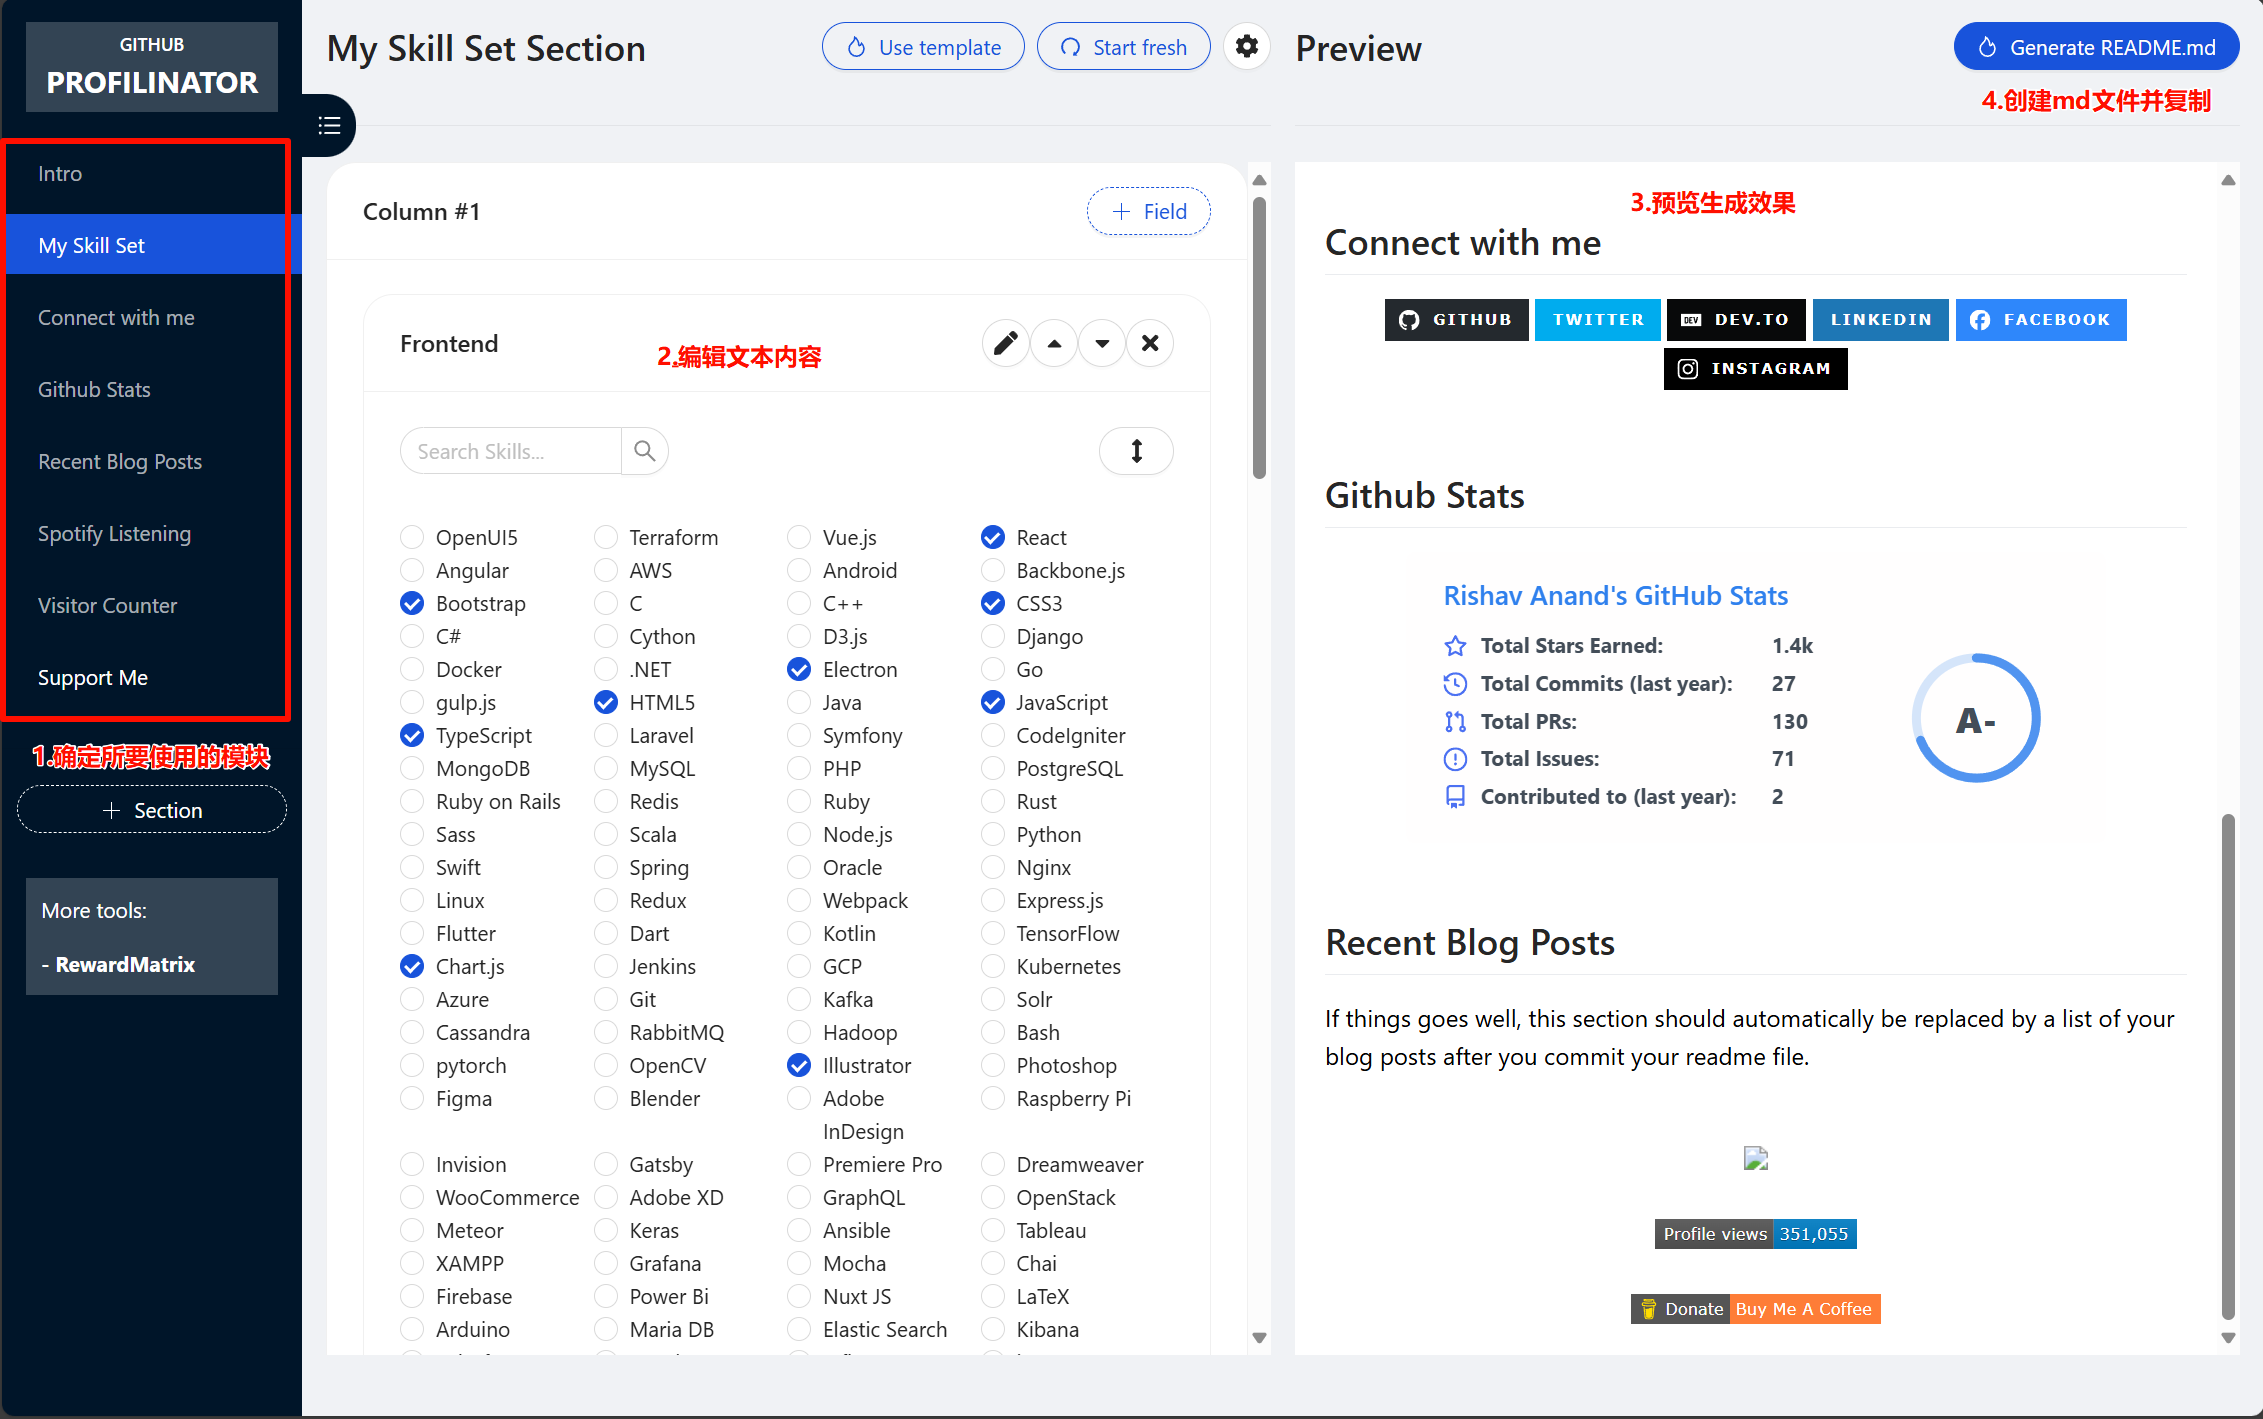
At the end.
Thanks again to all the creators of the open source components and the authors of the respective configuration curriculum, which helped in the configuration of the opener.
Super-detailed GitHub homepage beautification tutorial - peterjxl - Blog Park
Comments